
MRC Fly
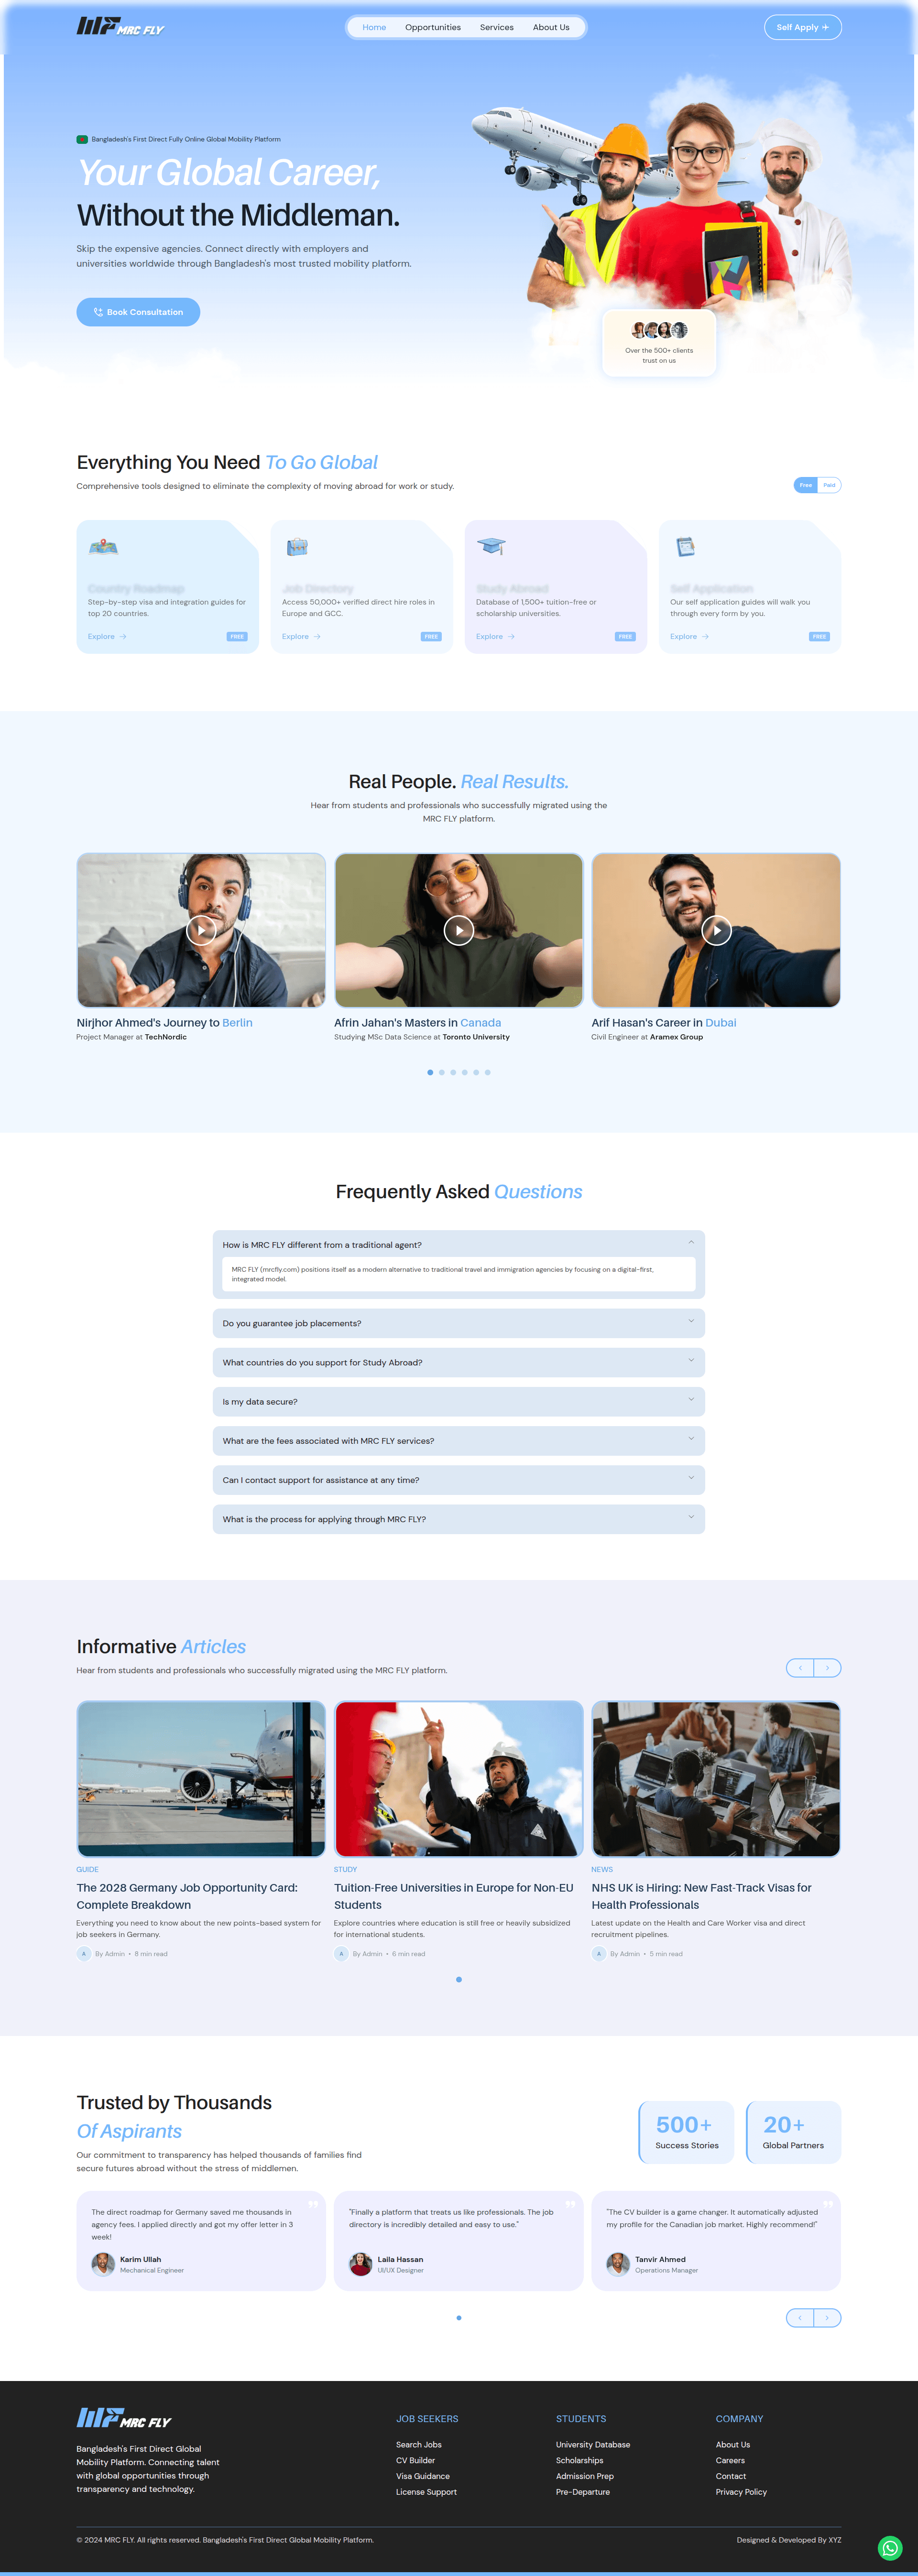
A direct-hire mobility platform for jobs, study-abroad pathways, country roadmaps, and visa consultations — with Google auth, an admin CMS, and blue-green Docker deploys to mrcfly.com.
- >NestJS auth module (email + Google, refresh cookies, session revoke)
- >Opportunity and country-roadmap APIs backing public and admin surfaces
- >GHCR images with blue-green deploy, Prisma migrate, and Nginx upstream swap
Project Vision & Meaning
MRC Fly is built for people in Bangladesh who want overseas work or study without a traditional agency as the gatekeeper. The public site has to sell trust — roadmaps, opportunities, webinars, consultations — while the backend has to become a real product: accounts, admin-managed listings, and a deploy path that can ship without downtime. The case is not 'a brochure website'; it is the conversion of a marketing surface into a mobility platform with a NestJS API.
Real-World Problems Solved
Users register or sign in with Google, keep a refresh session in an HttpOnly cookie, and hit a profile API. Admins manage job/study opportunities and country roadmaps from the CMS. Public pages read those records (with static fallbacks where content is still being migrated). Production runs two container colors behind Nginx: GitHub Actions build GHCR images, the VPS pulls, migrates Prisma, health-checks the new color, then swaps the upstream so mrcfly.com and api.mrcfly.com cut over without a blank window.
Challenges & Solutions
Google OAuth and Refresh Cookies Across Apex and API Hosts
Problem Context:The frontend lives on mrcfly.com; the API lives on api.mrcfly.com. Google's callback, the access token in memory, and the refresh cookie on path /auth all have to agree on host, SameSite, and CORS. A hardcoded localhost API URL in production sent OAuth users back to the wrong origin. A second Axios client (used by several query hooks) talked to a different port and skipped the refresh interceptor, so logged-in users still looked anonymous on data pages.
Centralized the authenticated client: Bearer access token, withCredentials, and a 401 → POST /auth/refresh retry. Production rewrites the API hostname to api.mrcfly.com. Google callback URLs are derived from the live frontend origin instead of a compile-time localhost default. Sessions can be listed and revoked from /users/me so a stolen refresh cookie is not permanent.
Migrating a Marketing Site to Database-Backed Listings
Problem Context:The first ship was a high-design marketing UI with mock arrays for jobs, universities, and roadmaps. Replacing those mocks in one cut would have taken the public site down or shown empty sections. Prisma models for webinars, resources, and consultations existed in schema files before matching SQL migrations, so a naive migrate deploy on the VPS would not create the tables the new modules expected.
Shipped opportunity and roadmap Nest modules first — the pages that must be CMS-editable — and kept static JSON fallbacks on country roadmap views so empty databases still render. Auth stayed in a clean-architecture module (domain / application / infrastructure / presentation); content modules used a thinner controller → service → Prisma path to move faster. Deploy always runs prisma migrate deploy before traffic switches, so schema and containers stay paired.
Zero-Downtime Deploys on a Single VPS
Problem Context:There is no managed container platform. A compose restart of one backend container dropped API connections during Prisma generate and killed in-flight OAuth callbacks. Frontend and backend images also drifted (pnpm in Docker, bunx in local FE scripts, Node 22 vs 20 in the frontend Dockerfile) which made 'works on my machine' a release risk.
Blue-green ports: the new color boots beside the live color, runs migrations, then Nginx swaps the upstream. GitHub Actions builds and pushes ghcr.io images on main, SSHs to the VPS, and runs deploy.sh. Compose pins the images the pipeline produced rather than building on the server, so the VPS is a runner, not a compiler.